Introduction
Along its entire life cycle, the food sector makes up 15-30% of total greenhouse gas emissions (1,2). Because of this and due to the high degree of personal choice and possible day-to-day selection, food represents an opportunity for consumers to contribute to climate change reduction. Nevertheless, we should not forget that food provides nutrients and prevents diseases, aspects of increasing concern among consumers.
The contribution of food to global warming has mainly been assessed via carbon footprint (CFP), a quantification method for greenhouse gas emissions emitted along the life cycle of a product (3). Although CFP represents only one part of environmental impacts of food products, the relationship between food consumption patterns and climate change is a subject of great concern (4). Furthermore, a major advantage of CFP is the reduced complexity when computing and interpreting the results (5,6), which is related to the global character of climate change.
To influence consumer food choices and therefore lower the CFP, reliable and easily comprehensible information is needed. Health and environmental effects of foods are, however, not necessarily convergent (7,8). Furthermore, the missing knowledge resulting from the psychological distance between the consumer and the CFP caused by their consumption hampers the possibility of consumers to recognize and lower their impact. For these reasons, integrating the nutritional content and CFP of diets into a single aggregated number is of great importance to communicate information to the public and to decision-makers. Previous studies show these indicators separately (e.g. 8,9). The eco-nutritional-efficiency (ENE) presented in this paper is one way to aggregate nutritional aspects and the CFP of diets into a unique value.
In engineering, efficiency is defined as the weighted sum of outputs divided by the weighted sum of inputs. Based on this definition, the ENE is defined as the amount of nutritional value (output) which is provided per CFP caused (input). The weighting in the aggregation of numerous nutritional values and the CFP can be assigned either by expert judgment or based on a specific weighting method (10). Data Envelopment Analysis (DEA) is a widely used technique to quantify efficiency in production units, which avoids subjective weighting (11). DEA can be used to integrate different dimensions, e.g. resulting from nutritional and environmental assessments. Therefore, the goal of this study is to examine DEA as a method to measure the ENE of menus integrating their CFP and macronutrients content into a single indicator. Two ENE indices are proposed with regard to two approaches for the nutritional assessment: model 1 is based on the nutritional content, while model 2 additionally includes a nutritional performance measure. A case study is used to test the models by comparing 256 daily menus. Macronutrient recommendations have been used as a diet quality index as there is a growing amount of evidence that a major imbalance in their relative proportions can increase risk of chronic disease and may adversely affect micronutrient intake (12).
Methods
Daily menus
The menus are established with regard to the nutritional quality, familiarity of foods, the variability of the CFP of food products (e.g. fresh vegetables or meat) and the availability of CFP information. The origin of all products was Spain, where the food was consumed. Based on the Seven Countries Study[1] (13), 16 meals (4 breakfasts, 4 lunches, 4 snacks and 4 dinners) were designed (Table 1). These meals are the basis from which the menus were built. Each of the four breakfasts (and the same with the rest of meals) represents a stereotyped diet (Spanish mediterranean, m; western, w; standard, s; and ovo-lacto-vegetarian, v). In general, consumers do not follow a strict diet but mix foods and vary portions according to personal criteria and preferences. To mimic this consumer behavior, the 16 meals were freely combined to menus with 4 meals each, leading to 256 different daily menus. Using 256 daily menus, a sufficient level of discrimination for DEA is reached (14). The menus were named according to their meals (breakfast/snack/lunch/dinner); wsvm is then a daily menu with a western breakfast, a standard snack, a vegetarian lunch and a mediterranean dinner. To allow for a fair comparison, all daily menus were normalized to 2000 kcal person−1 day−1 (15).
Carbon footprint assessment
The CFP of the products was obtained from literature (see details in Supplementary Material). For calculating the CFP of the daily menus, the preliminary CFP data per kg of food product were multiplied by menu composition (Table 1). The PAS 2050:2011 guidelines (BSI, 2011) were used to analyze the quality of all data sources. When only information about primary agricultural production was available, some life cycle stages were added, mainly processing, transport or cooking. According to PAS 2050:2011 capital goods production and the transport from retailer to consumer were excluded. Furthermore, where no data was available, the impact of packaging was assumed to be negligible (16).
To reach a geographical specificity where literature from other countries was used, the MEXALCA method for the extrapolation of crop LCA (17) was applied. Details about the life cycle stages added for each product, the origin, and the applied regionalization can be found in the Supplementary Material.
Nutritional assessment
Nutritional values per edible portion were obtained from databases (USDA, 2011 (18); software dietowin® 7.3), and the nutritional assessment of each daily menu was then carried out according to two approaches.
In approach 1, the absolute macronutrient contents were used. In contrast, approach 2 took into account the Recommended Daily Intake (RDI) (19) fractions of macronutrients. According to Mahan and Escott-Stump (20), 12-15% of all calories should be delivered by proteins, 30-35% by fat and 50-55% by carbohydrates. These guidelines were used to calculate the nutritional performance using an Extent of Compliance Indicator (ECI), defined as:
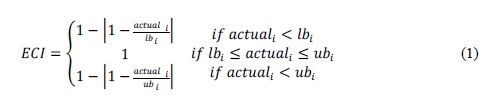
Equation (1) distinguishes between three cases. If the actual content of nutrient i (percentage of total calorific input) is below the lower bound (lb) or above the upper bound (ub), the ECI is smaller than 1. If it lies within the range of the RDI, the ECI equals 1.
Integration of results
This study aims to aggregate the results obtained to provide a unique number, the ENE. The ENE describes the amount of nutritional value gained while causing a certain CFP. The nutritional value of a daily menu, represented by the macronutrients, constitute the model outputs. DEA is used to aggregate these multiple outputs, as it allows for combination of different indices avoiding explicit weights (11). The most general model, the CCR-model (21) is used. This model assumes that the relationship between nutritional contents and CFP is constant for each menu, no matter the amounts consumed.
Two CCR-models, based on the efficiency definition given above, are presented below (see 11,22) for mathematical description). The models (Eq. (3) and (5)) imply that one optimization program is solved for every daily menu (i.e. a total of 256 linear programs are solved for each model). For a given daily menu, the optimization procedure calculates a set of weights for the nutritional values and the CFP to maximize the ENE ratio with the restriction that the same set of weights is applied to the rest of the scenarios and will not allow an ENE ratio greater than 1. This results in a set of the most favorable weights for each daily menu. The resulting ENE lies between 0 and 1, where 1 represents being efficient.
As DEA assesses the relative efficiency of one daily menu within the group of all daily menus taken into account, only the relative position of a daily menu within the group is relevant. For this reason, the analysis of results was performed using the Spearman’s rank correlation coefficient (r).
Model 1
Equation (2) gives the eco-nutritional-efficiency using approach 1 for the nutritional assessment, where mji is the weight assigned to the output (nutrional value) j of the meal i and nji is the weight of the input (environmental impact) k of the daily menu i. Equation (3) shows the model as applied within the case study. Using model 1, the nutritional content of a daily menu is maximized since absolute values of the nutritional inventory are used
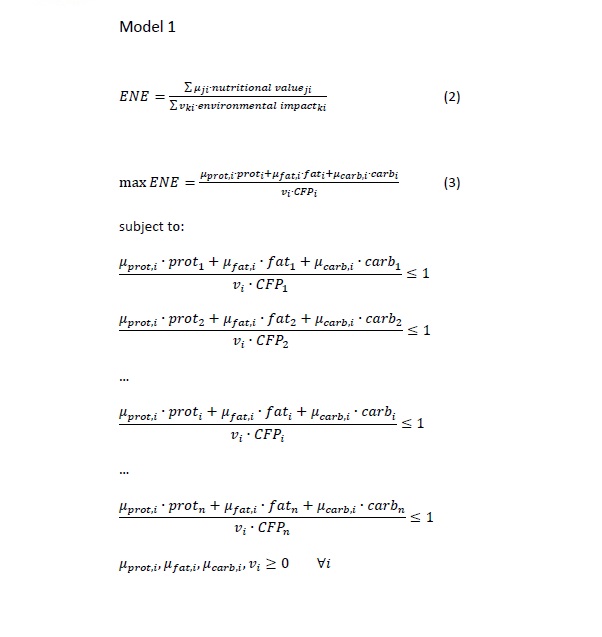
Proteini, fati, carbohydratei and carbon footprinti are the nutritional values (kcal) and CFPi is the carbon footprint (kg eq. CO2) of the menu i (i=1…256). mprot_i , mfat_i and mcarb_i are the weights of the protein, fat and carbohydrate content of the menu i, and nCFP_i is the weight of the CFP of the daily menu i.
Model 2
To account for a balanced nutrition, model 2 uses the extent of compliance indicator (ECI) for the nutritional assessment. The ECIi for all nutritional values i are entered into a DEA model, leading to model 2 (Eq. (4)). Eq. (5) shows model 2 as applied within the case study.
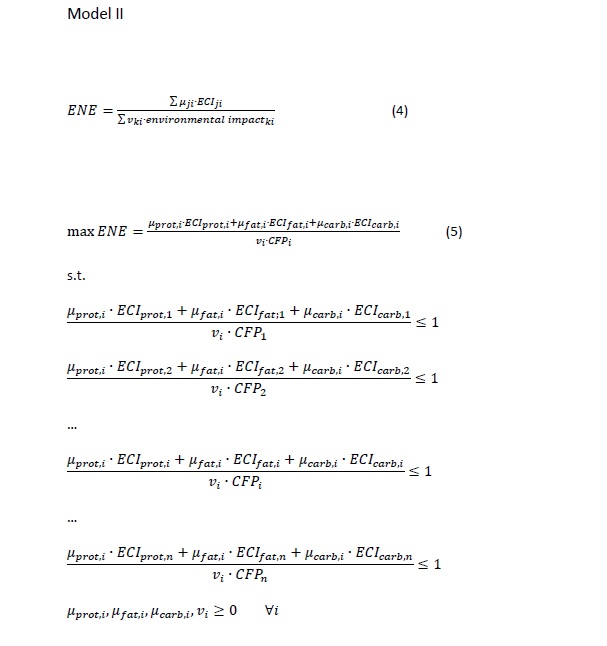
ECIprotein,i, ECIfat,i, ECIcarbohydrate,i are the ECI of the nutritional values and CFP i is the CFP (kg eq. CO2) of the menu i (i=1…256). mj,i is the weight of the ECI j (j=1…3) and nl,i is the weight of the CFP (k=1).
As the maximization procedure leads to a favorable efficiency if the values for the ECIi reach their maximum, daily menus that are close to or within the RDI (high ECI, see Eq. (1)) are rated as more efficient.
Results
Environmental and nutritional assessment
In Fig. 1 and Fig. 2, the results of the CFP and the nutritional assessment are shown. In these figures, the menus are sorted according to their meals: firstly, the structure is dominated by the lunch, the largest meal in terms of calorific content and CFP. Secondly, all daily menus having the same lunch were sorted according to their dinner, followed by breakfast and snacks.
Significant differences among the CFP of daily menus were found (between 2.02 kg CO2-eq [vmvv] and 5.16 kg CO2-eq [wwww]) (Figure 1). Among the four stereotyped daily menus, the vegetarian one (vvvv) performs best (2.28 kg CO2-eq). Within the daily menu inspired by a western diet, the consumption of animal protein produces 2.97 kg CO2-eq, which leads to the overall worst result of 5.16 kg CO2-eq. The CFP from meat consumption within the mediterranean and standard daily menus contribute 34% and 46%, respectively, to the overall result. Vegetal proteins included in the vegetarian menu are consumed as pea burgers and contribute only 18% to its CFP. Overall, lunch and dinner together provide 62% to 85% of the menus’ calorific content and cause 60% to 95% of the CFP. The CFP is positively correlated with fat and protein content and negatively correlated with carbohydrates and, therefore, meat content is positively correlated with CFP (Table 2).
The nutritional content of food products also varies widely (Fig. 2). Single meals do not often fulfill the health guidelines regarding the distribution of macronutrients. The vegetarian breakfast includes >90% carbohydrates, while the western snack consists of 65% fat. Owing to these unbalanced meals, only 29 daily menus out of 256 follow the health guidelines pointed out previously.
Integration of results
When applying model 1, the daily menus analyzed have an ENE between 0.48 and 1, while for model 2 it is between 0.42 and 1 (Fig. 3). Eight daily menus are found to be efficient with model 1 (mmvs, mwvs, smvs, swvs, mmvv, smvv, vmvv and swvv), all of them containing the vegetarian lunch. Additionally, they consist of the vegetarian or standard dinner and the western or mediterranean snack. Since lunch is the meal with the highest calorific content, it is the most decisive factor. The macronutrient content of the vegetarian lunch is close to the nutritional guidelines, and its CFP is 31% to 78% smaller than the CFP of other lunches. Model 1 efficiencies show a strong correlation with the CFP (r=-0.89), the negative sign meaning the higher the CFP the lower the ENE. It can also be observed that the efficiency variation of menus with the vegetarian lunch (daily menus xxvx, where x can be any meal) is large (ENEs between 0.55 and 1), but the variation is quite small for the western lunch (0.38-0.48). The same is observed for dinner (xxxv versus xxxw).
While in model 1 menus including the western dinner can sometimes outperform the other daily menus, this is not possible using model 2, as the western dinner has a small calorific value but a large CFP. Model 1 is able to compensate the higher CFP with a high weight on protein, therefore showing the weakness of maximizing the nutrient content. Within model 2, the high protein content is rated with an ECI below 1, leading to a lower ENE.
The average ENE using model 2 is 0.62, which is lower compared to model 1 (0.65). Only a subset of the above mentioned menus rated as efficient were also efficient using model 2: mmvv, smvv and vmvv. All of them include the mediterranean snack and the vegetarian lunch and dinner; only the breakfast varies (xmvv). As macronutrient contents for all 256 menus are close to the RDI guidelines, the ECI is similar for all menus, and the CFP gains importance (r=-0.98). For both models, the correlation to the nutritional values is small for protein and fat, and it reaches 0.51 as a maximum for carbohydrates.
Fig. 4 summarizes the results of model 2. It shows the ENE and the included meals of the corresponding daily menus. Menus are sorted according to their ENE. To simplify the graph, average compositions of eight daily menus (as indicated on the x-axis) and their average ENEs are displayed. The composition regarding the four stereotyped diets is calculated by assigning 25% to each meal (breakfast, snack, lunch and dinner). The eight most efficient daily menus consist of approximately 55% vegetarian meals, and daily menus with low efficiencies include more than 70% western meals. While the mediterranean dishes are slightly more present in daily menus with a higher efficiency, standard meals can mainly be found at lower efficiencies. These numbers do not differ significantly when model 1 is used.
Spearman’s rank correlation coefficient for the relation between the content of meat within a daily menu and the ENE of all menus was found equal to r=-0.52 and r=-0.67 for both models (Table 2). This agrees with prior studies emphasizing the advantages of vegetarian diets (16, 23) and is highlighted by the presence of the vegetarian lunch in all efficient menus.
While weights in model 1 reflect the relative importance of sources of calories, in model 2 they reflect the importance of achieving the RDI for single macronutrients. In model 1 no macronutrient determined the ranking, i.e. no macronutrient was rated with 100% for most menus. The relative weights found in model 2 reveal a different picture. As all menus are close or within the RDI guidelines, the calculation of the ECI led to 50% smaller coefficients of variation.
Discussion
The daily menus showed an ENE between 0.42 and 1, which means that with nutritional values kept constant, the CFP could be reduced by up to 58%. As mentioned in the introduction, food causes 15-30% of the European CFP. Consequently, a reduction of up to 17% of the CFP from food would constitute a significant improvement, in line with the present goal of the EU that is attaining a 20% reduction of GHG in 2020. Additionally, the variation of efficiencies confirmed the possible influence of day-to-day consumer choices.
In the case study, the number of products used to design the menus was limited by data availability. The CFPs of all menus are within the same range but slightly lower than those found by (7) for real diets. The lower CFP can be attributed to the normalization to 2000 kcal person−1 day−1 compared to an average of 2118 kcal person−1 day−1 in (7). A higher variability of CFP and nutritional values would influence the ENE scores of the menus, since the model measures the ENE relative to the “best menu” in the sample, which is not necessarily the same as the best available menu. Although the use of real self-selected diets including a wide variety of products would be better for making recommendations to consumers, the results of this study highlight the importance of the protein source (vegetable vs. animal protein).
The performance measurement is crucial in determining the choice of the model and therefore the ENE. As a first step, the quantity of macronutrients was maximized in model 1. Next, to take into account a nutritional performance measurement, model 2 including the ECI was successfully implemented. Use of the ECI in rating the degree of compliance with health regulations proved to be a valuable tool, as extreme values are no longer rated positively. Using model 2 also led to higher relative efficiencies of the healthy daily menus showing the stronger focus on a balanced nutrition. None of the 29 menus that scored as healthy in the nutritional assessment (section 3.1), however, were rated as efficient within model 2 since the CFP of all these menus was too high.
The environmental performance can be assessed using life cycle assessment (LCA), a valuable and widely applied tool to assess the contribution of a product not only to global warming, but also to other environmental impact categories (e.g. eutrophication or water use). In case other impact categories were included in the index, DEA would assign weights to these impact categories, too.
As a first approximation, the macronutrients were taken as representative for the nutritional values to simplify the interpretation and comparison of the models. Nutrient profiling (24) shows a possible indicator regarding nutrition that includes micronutrients, which can be integrated in both models. This would provide in-depth knowledge about the menus and would allow the testing based on the need of specific population groups (e.g. elderly people, children).
Conclusions
Knowledge of nutrition and CFP can avoid simplistic and erroneous conclusions for food recommendations. The ENE succeeds in aggregating the CFP and nutritional aspects to create a unique value that can support decision-making. As the reporting includes both nutritional and environmental factors, trade-offs no longer hamper decisions. Promoting a more eco-nutritionally-efficient diet enhances the resource and energy efficiency while taking into account consumers’ health. While model 1 represents a basic model for the combination of CFP and nutritional aspects using DEA, model 2 also measures menu’s nutritional performance. Both models allow for the inclusion of more nutritional aspects (e.g. micronutrient content) and environmental impacts.
The use and communication of the ENE can empower stakeholders to shape food consumption more sustainably. The presented DEA models reach this goal by avoiding subjective weighting. Instead, DEA looks for a set of most favorable weights for each menu. When a specific menu achieves an ENE lower than 1, it means that even using the most favorable weights (for that specific menu) there is at least another menu which is able to obtain an ENE equal to 1 using the same set of weights.
Several model improvements were found. Further environmental impacts such as water use or eutrophication relevant and closely linked to food production could be also used. Additionally, a measure of the nutritional performance regarding micronutrients can be incorporated. In this way, general conclusions regarding nutritional performance, such as the change of protein sources, would be facilitated.
Acknowledgments
We gratefully acknowledge the financial support from the Spanish Ministerio de Ciencia e Innovación (CTM2010-18118).
References
- Tukker A, Jansen B. Environmental Impacts of Products: A Detailed Review of Studies. J Ind Ecol 2006; 10(2):159-182.
- Garnett T. Cooking up a storm - Food, greenhouse gas emissions and our changing climate. Food Climate Research Network, Centre for Environmental Strategy, University of Surrey, 2008.
- BSI, 2011. PAS 2050. Specification for the assessment of the life cycle greenhouse gas emissions of goods and services. Publicly available specification, British Standards Institution, U.K.
- Davis J, Sonesson U, Baumgartner DU, Nemecek T. Environmental impact of four meals with different protein sources: Case studies in Spain and Sweden. Food Res Int 2010; 43:1874-1884.
- Vázquez-Rowe I, Iribarren D, Moreira MT, Feijoo G. Combined application of Life Cycle Assessment and Data Envelopment Analysis as a methodological approach for the assessment of fisheries. Int J Life Cycle Assess 2010; 15:272–283.
- Weidema BP, Thrane M, Christensen P, Schmidt J, Løkke S. Carbon Footprint. J Ind Ecol 2008; 12:3-6.
- Vieux F, Darmon N, Touazi D, Soler LG. Greenhouse gas emissions of self-selected individual diets in France: Changing the diet structure or consuming less? Ecol Econs 2012; 75:91-101.
- Vieux F, Soler L.-G, Touazi D, Darmon N. High nutritional quality is not associated with low greenhouse gas emissions in selfselected diets of French adults. Am J Clin Nutr 2013; 97(3): 569−583.
- van Dooren C, Marinussen M, Blonk H, Aiking H, Vellinga P. Exploring dietary guidelines based on ecological and nutritional values: A comparison of six dietary patterns. Food Policy 2014; 44:36–46.
- Rüdenauer I, Gensch C-O, Grieshammer R, Bunke D. Integrated environmental and economic assessment of products and processes: A method for eco-efficiency analysis. J Ind Ecol 2005; 9:105-116.
- Cooper WW, Seiford LM, Tone K. Introduction to Data Envelopment Analysis and Its Uses. USA Springer Science+Business Media Inc, 2006.
- Key T, Fraser G, Thorogood M, Appleby P, Beral V, Reeves G. Mortality in vegetarians and nonvegetarians: detailed findings from a collaborative analysis of 5 prospective studies. American J Clin Nutr 1999; 70S:516S–524S.
- Keys AB. Seven Countries: A Multivariate Analysis of Death and Coronary Heart Disease. Cambridge, Harvard University Press, 1970.
- Dyson RG, Allen R, Camanho AS, Podinovski VV, Sarrico CS, Shale EA. Pitfalls and protocols in DEA. Eur J Oper Res 2001; 132:245-259.
- Heller MC, Keoleian GA, Willett WC. Toward a life cycle-based, diet-level framework for food environmental impact and nutritional quality assessment: a critical review. Environ Sci Technol 2013; 47:12632−12647.
- Jungbluth N, Tietje O, Scholz R. Food purchases: impacts from the consumers' point of view investigated with a modular LCA. Int J Life Cycle Assess 2000; 5:134-142.
- Roches A, Nemecek T, Gaillard G, Plassmann K, Sim S, King H, Milà i Canals L. MEXALCA: a modular method for the extrapolation of crop LCA. Int J Life Cycle Assess 2010; 15:842-854.
- USDA. United States Department of Agriculture. National Nutrient Database for Standard Reference. [Accessed on 2012 April to June]. URL available at: http://ndb.nal.usda.gov/.
- Cuervo M, Corbalan M, Baladia E, Cabrerizo L, Formiguera X, Iglesias C, Alfredo J.. Comparativa de las ingestas dietéticas de referencia (IDR) de los diferentes países de la Unión Europea, de Estados Unidos (EEUU) y de la Organización Mundial de la Salud (OMS). Nutr Hosp 2009; 24(4):384-414.
- Mahan KL, Escott-Stump S (eds). Krause's Food, Nutrition & Diet Therapy 10th ed. Philadelphia PA: Wb Saunders, 2000.
- Charnes A, Cooper WW, Rhodes E. Measuring the efficiency of decision making units. Eur J Oper Res 1978; 2:429-444.
- Ray SC. Data Envelopment Analysis: Theory and techniques for economics and operations research. Cambridge Universtiy Press, U.K 2004.
- Carlsson-Kanyama A, Ekström MP, Shanahan H. Food and life cycle energy inputs: consequences of diet and ways to increase efficiency. Ecol Econ 2003; 44:293-307.
- Fulgoni VL, Keast DR, Drewnowski A. Development and validation of the nutrient-rich foods index: a tool to measure nutritional quality of foods. J Nutrition, 2009; 139:1549-1554.
[1] The Seven Countries Study was the first study to systematically examine the relationships between lifestyle, diet, coronary heart disease and stroke in different populations from different regions of the world.